

What Is Accuracy, Precision, Recall, and F1 Score?
A clear guide to the most common classification metrics in machine learning: accuracy, precision, recall, and F1 score. Learn when to use each metric and how they relate to real-world model performance.

Ted Tigerschiold
When building a machine learning classification model, choosing the right evaluation metric is just as important as choosing the right algorithm. Accuracy, precision, recall, and F1 score are the four most commonly used metrics, and each tells you something different about how well your model is performing. Understanding the distinction between them is critical for making informed decisions about model quality, especially in domains where errors have real consequences.
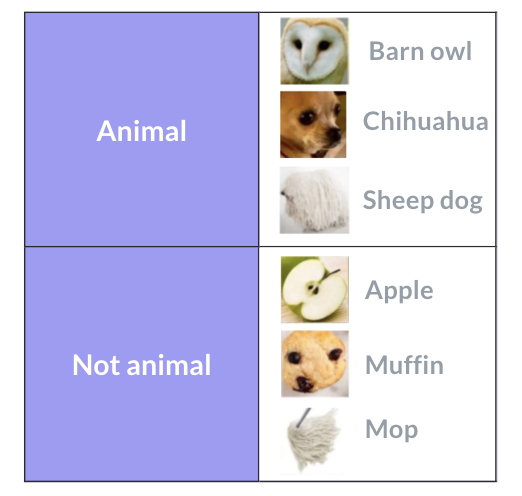
To make these concepts concrete, let’s imagine we work at “Aarons Animal Classifiers Inc.” Our job is to evaluate four different classification models. Each model is given the same set of six test images and must predict whether each image is an animal or not an animal. Three of the images are animals (a barn owl, a chihuahua, and a sheepdog) and three are not (a mop, a muffin, and a pineapple). Our goal is to figure out which model performs best — and to do that, we need to understand accuracy, precision, recall, and F1 score.
The fundamental concepts: True/False and Positive/Negative
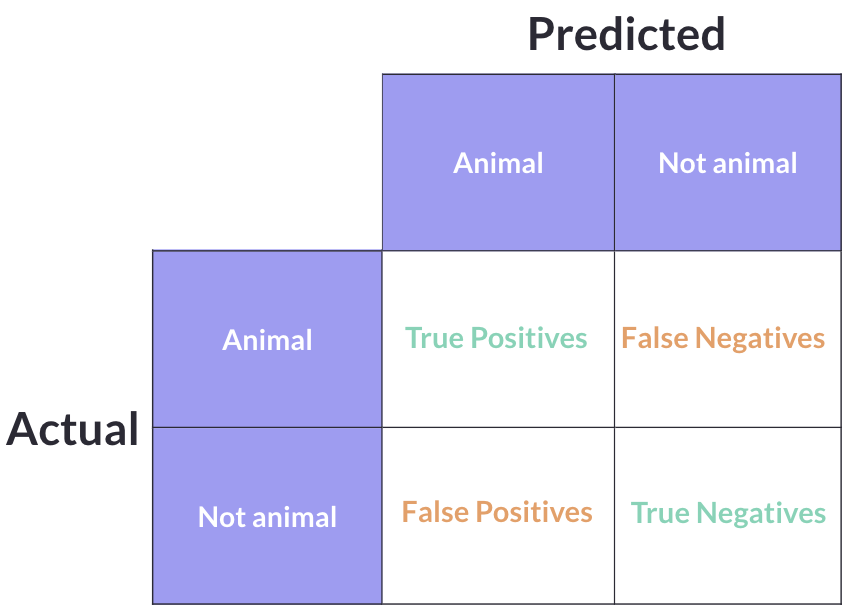
Before we can calculate any metric, we need to understand the confusion matrix — the foundation that all classification metrics are built on. Every single prediction a model makes falls into one of four categories:
- True Positive (TP): The model predicted “animal” and it actually was an animal. The model got it right.
- True Negative (TN): The model predicted “not animal” and it actually was not an animal. The model got it right.
- False Positive (FP): The model predicted “animal” but it was actually not an animal. The model was wrong — it raised a false alarm.
- False Negative (FN): The model predicted “not animal” but it was actually an animal. The model was wrong — it missed one.
The key to remembering these is simple: True/False tells you whether the model was correct or not. Positive/Negative tells you what the model predicted. A “False Positive” means the model incorrectly predicted positive.
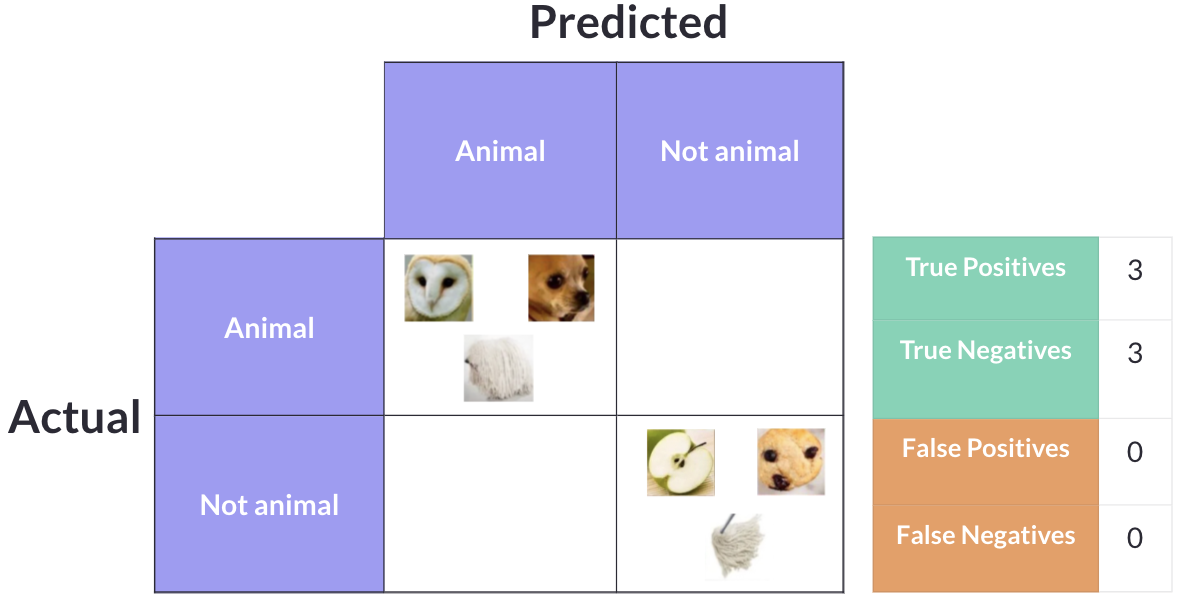
If a model were perfect — correctly identifying all three animals as animals and all three non-animals as non-animals — the confusion matrix would show 3 True Positives and 3 True Negatives, with zero False Positives and zero False Negatives.
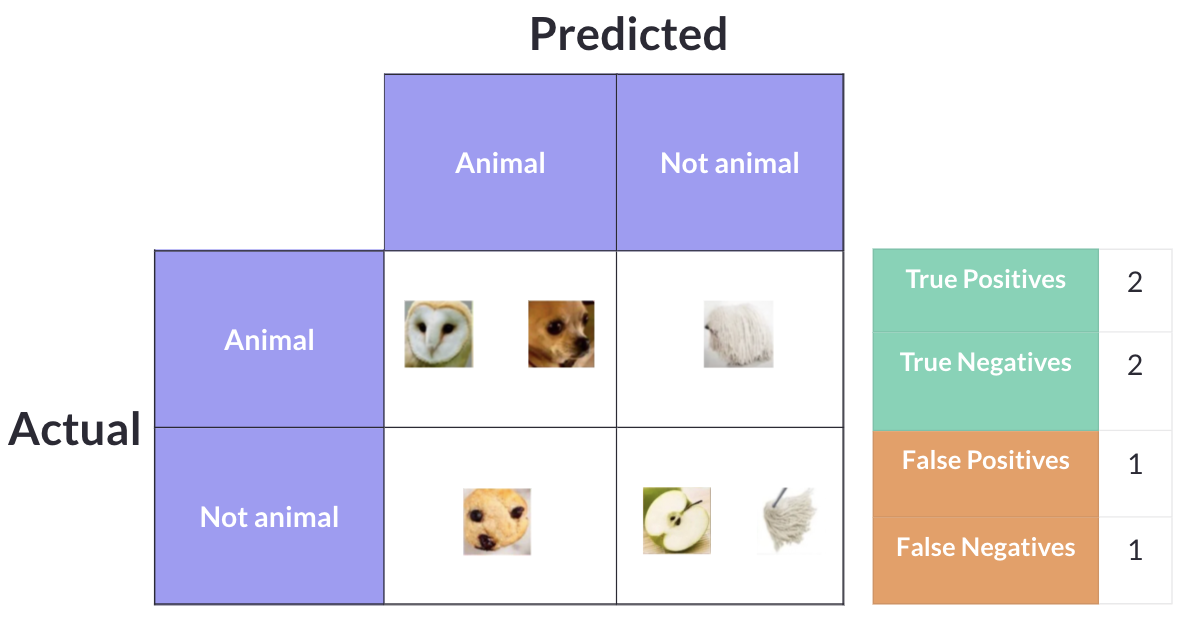
In practice, models make mistakes. A model might correctly identify two animals but miss the third, while also incorrectly labeling the mop as an animal. That would give us 2 True Positives, 2 True Negatives, 1 False Positive, and 1 False Negative.
Now that we understand these four categories, we can define each metric.
Accuracy
“Out of all predictions made, how many were correct?”
Accuracy is the simplest and most intuitive metric. It counts up all the correct predictions (both True Positives and True Negatives) and divides by the total number of predictions:
Accuracy = (TP + TN) / (TP + TN + FP + FN)
In our animal example, if a model correctly classifies 5 out of 6 images, it has an accuracy of 5/6 = 83.3%.
While accuracy is easy to understand, it can be deeply misleading when classes are imbalanced. Imagine a dataset with 950 non-animals and 50 animals. A model that blindly predicts “not animal” for every single image would achieve 95% accuracy — but it would be completely useless at the actual task of finding animals. This is why accuracy alone is never enough.
Precision
“Out of all positive predictions made, how many were actually correct?”
Precision focuses exclusively on the predictions the model labeled as positive. Of all the times the model said “this is an animal,” how often was it right?
Precision = TP / (TP + FP)
High precision means the model rarely cries wolf — when it says something is an animal, you can trust it. Low precision means the model is labeling too many non-animals as animals (lots of false positives).
Precision is the metric to prioritize when false positives are expensive. For example, a spam filter should have high precision because flagging a legitimate email as spam (a false positive) could mean a user misses something important.
Recall
“Out of all data points that should be predicted as positive, how many did we correctly predict?”
Recall looks at the problem from the other direction. Of all the images that actually are animals, how many did the model successfully identify?
Recall = TP / (TP + FN)
High recall means the model rarely misses a positive case — it catches almost everything. Low recall means the model is letting too many actual positives slip through (lots of false negatives).
Recall is the metric to prioritize when false negatives are expensive. For example, a medical screening test for cancer should have high recall because missing an actual case (a false negative) could cost someone their life.
Precision and recall are often in tension with each other. A model can trivially achieve 100% recall by predicting everything as positive — but its precision would plummet. Conversely, a model can achieve near-perfect precision by only predicting positive when it is extremely confident — but it will miss many actual positives, tanking recall.
F1 Score
The F1 score resolves the tension between precision and recall by combining them into a single number using the harmonic mean:
F1 = 2 × (Precision × Recall) / (Precision + Recall)
Why the harmonic mean instead of a simple average? Because the harmonic mean penalizes extreme values. If a model has 100% precision but 10% recall, a simple average would give 55% — which sounds decent. The harmonic mean gives 18.2% — which more accurately reflects how poor the model really is. The F1 score is only high when both precision and recall are reasonably high.
The F1 score is especially useful when you do not have a clear reason to favor precision over recall or vice versa, and you want a single balanced metric to compare models.
Evaluating the four models
Now let’s put these metrics to work and evaluate our four animal classification models.
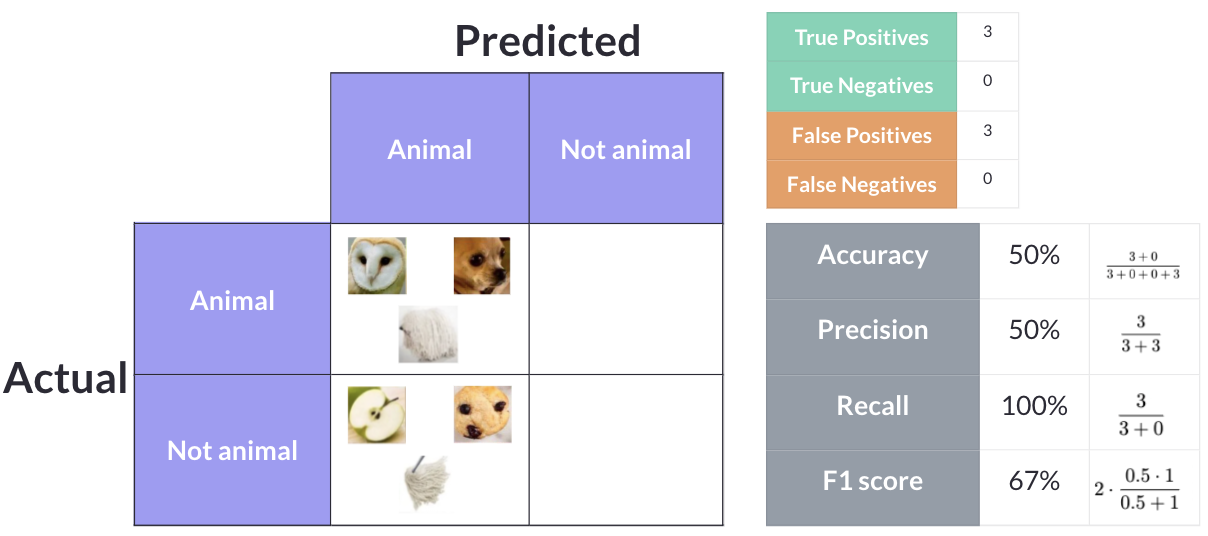
Model 1: Predict everything as “animal”
Model 1 takes the simplest possible approach — it classifies every single image as an animal. The three actual animals are correctly identified (3 True Positives), but the mop, muffin, and pineapple are all incorrectly labeled as animals too (3 False Positives). There are zero True Negatives and zero False Negatives.
- Accuracy: (3 + 0) / 6 = 50%
- Precision: 3 / (3 + 3) = 50%
- Recall: 3 / (3 + 0) = 100%
- F1 Score: 2 × (0.5 × 1.0) / (0.5 + 1.0) = 66.7%
This model has perfect recall — it never misses an animal — but that is meaningless because it calls everything an animal. It is like a fire alarm that never stops ringing. Sure, it will catch every fire, but it is useless.
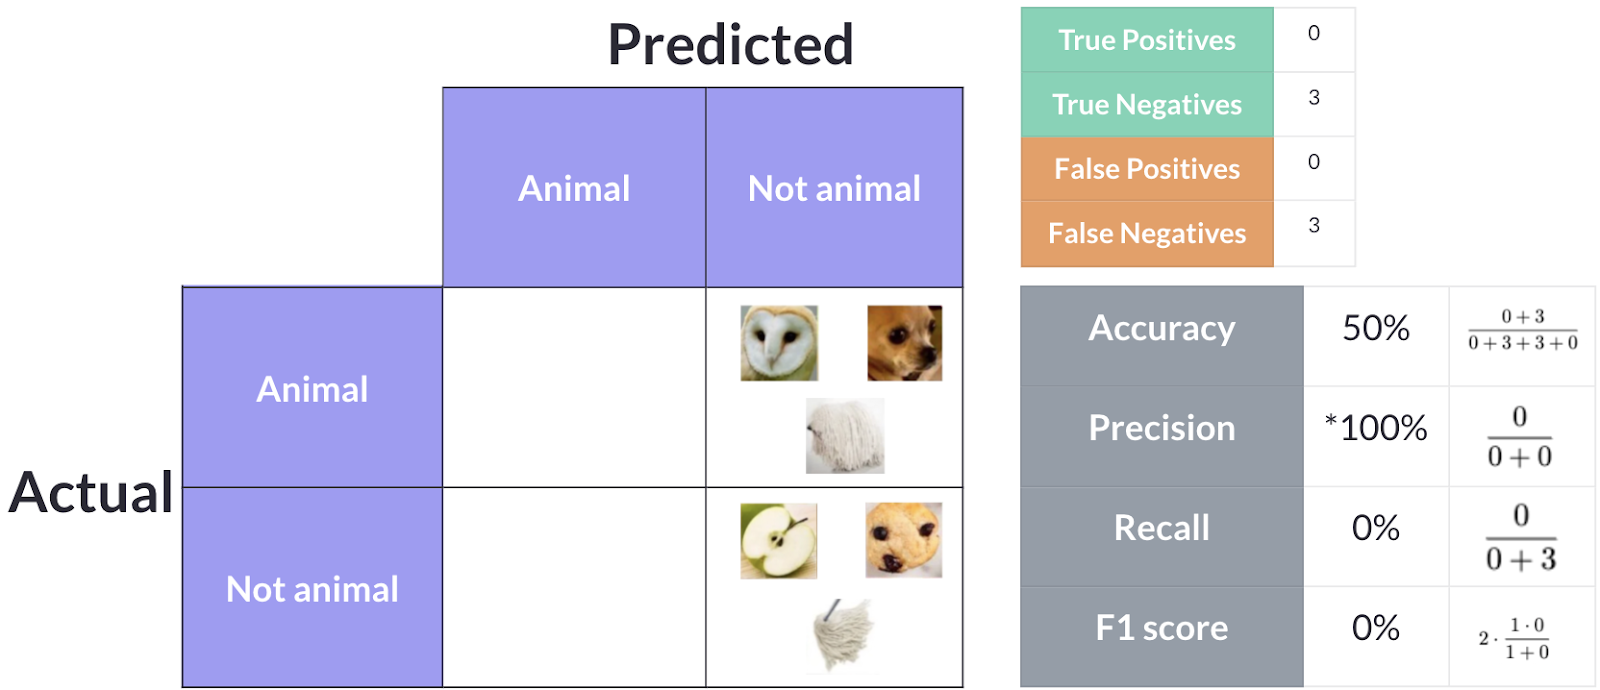
Model 2: Predict everything as “not animal”
Model 2 is the opposite extreme — it classifies every image as not an animal. The three non-animals are correctly classified (3 True Negatives), but all three actual animals are missed (3 False Negatives). There are zero True Positives and zero False Positives.
- Accuracy: (0 + 3) / 6 = 50%
- Precision: 0 / (0 + 0) = undefined (0%)
- Recall: 0 / (0 + 3) = 0%
- F1 Score: 0%
Interestingly, this model has the same 50% accuracy as Model 1, even though it behaves in the exact opposite way. This is a perfect example of why accuracy alone can be misleading — two models with identical accuracy can have completely different behaviors. With 0% recall and 0% F1, this model is clearly useless for finding animals.
Model 3: Overpredicts non-animals
Model 3 is more conservative — it only labels something as an animal when it is very confident. It correctly identifies one animal and correctly classifies all three non-animals, but it misses two of the actual animals. This gives us 1 True Positive, 3 True Negatives, 0 False Positives, and 2 False Negatives.
- Accuracy: (1 + 3) / 6 = 66.7%
- Precision: 1 / (1 + 0) = 100%
- Recall: 1 / (1 + 2) = 33.3%
- F1 Score: 2 × (1.0 × 0.333) / (1.0 + 0.333) = 50%
This model has perfect precision — every time it says “animal,” it is correct. But it achieves this by being overly cautious, missing two out of three animals. If you absolutely cannot tolerate false positives, this model might work, but it misses most of the actual animals.
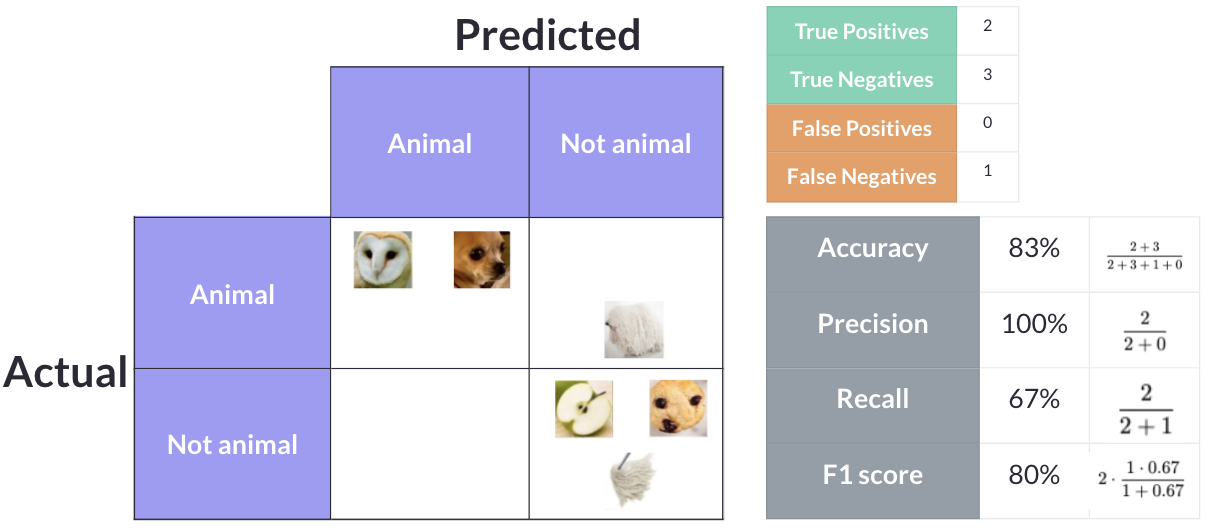
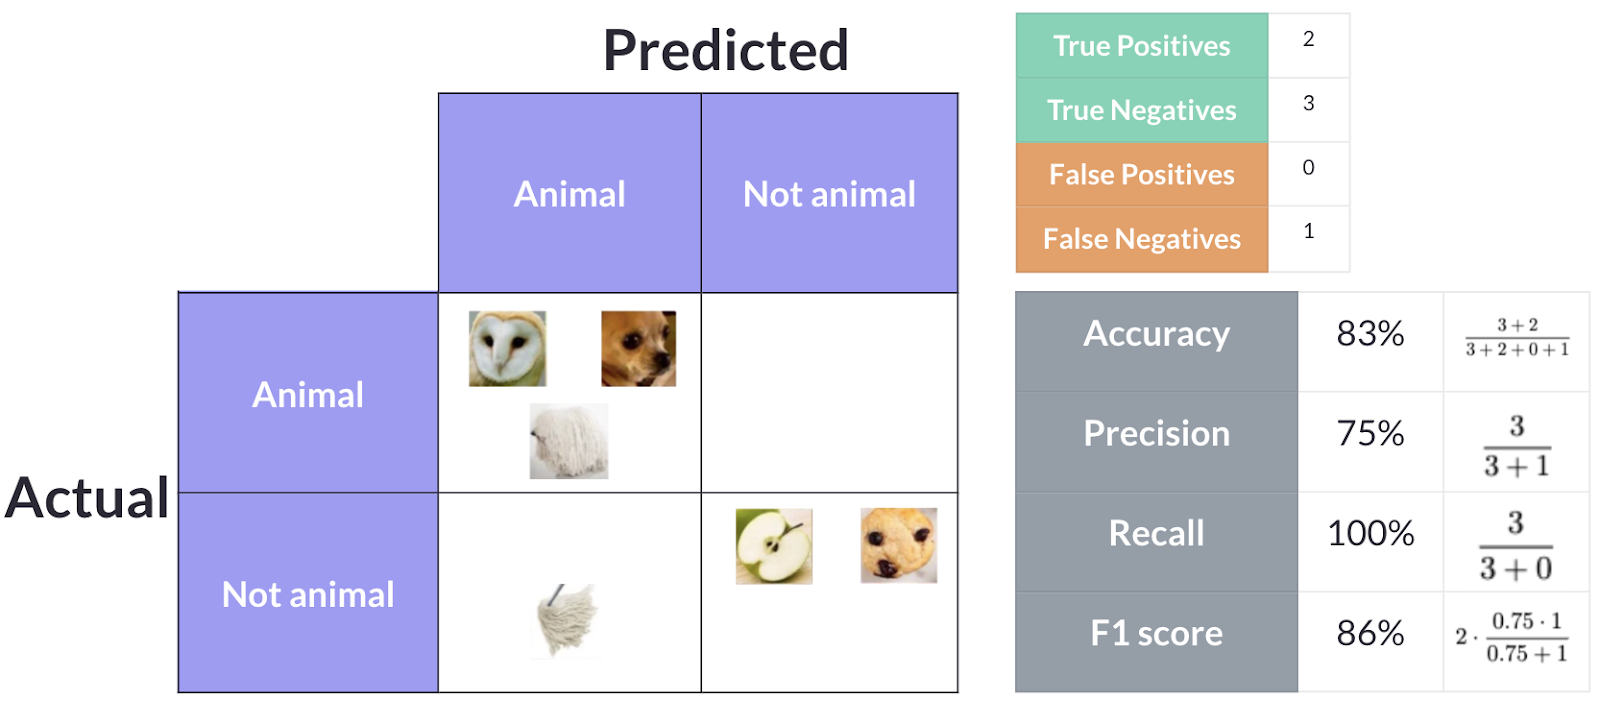
Model 4: Overpredicts animals
Model 4 leans the other way — it is more aggressive about predicting animals. It correctly identifies all three animals and two of the non-animals, but incorrectly classifies one non-animal as an animal. This gives us 3 True Positives, 2 True Negatives, 1 False Positive, and 0 False Negatives.
- Accuracy: (3 + 2) / 6 = 83.3%
- Precision: 3 / (3 + 1) = 75%
- Recall: 3 / (3 + 0) = 100%
- F1 Score: 2 × (0.75 × 1.0) / (0.75 + 1.0) = 85.7%
Model 4 achieves the highest accuracy (83.3%), the highest F1 score (85.7%), and perfect recall (100%). It catches every single animal, with the trade-off of one false positive. For most use cases, this is the best model of the four.
Conclusion
So which model is the “best”? It depends entirely on the use case.
- If missing an animal is unacceptable (e.g., detecting dangerous wildlife on a hiking trail), you want high recall — Model 4 is your best choice.
- If false alarms are unacceptable (e.g., flagging content for manual review where reviewer time is expensive), you want high precision — Model 3 would be preferred.
- If you want a single balanced metric, the F1 score gives you the best of both worlds — and Model 4 wins with 85.7%.
- Accuracy is a useful starting point, but as we saw with Models 1 and 2, two models can have identical accuracy while being wildly different in actual usefulness.
The key takeaway: never rely on a single metric. Understand what each metric measures, consider what kind of errors matter most in your specific context, and choose accordingly.
Ted Tigerschiold
COO & Co-Founder


